Omschrijving
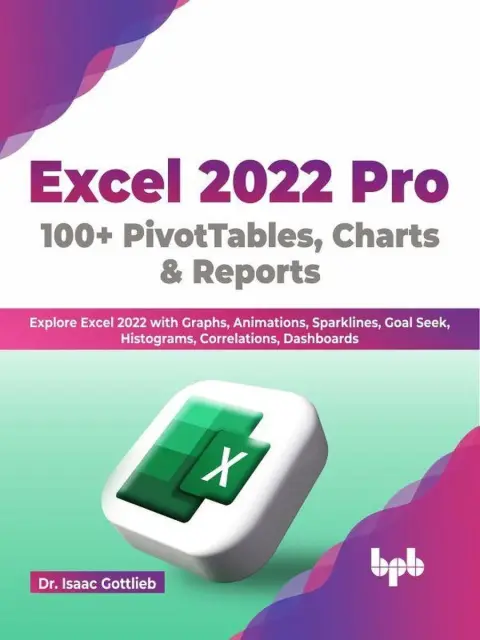
Learn Everything about Excel Charts, PivotTables, Dashboards and Master Analytic Techniques for Decision Making DESCRIPTION Excel's charts, graphs, and reports are beneficial, so it's time to use them to your advantage. Learn how to execute the most innovative analysis on your preferred data using PivotTables, PivotCharts, What-if-Analysis, descriptive statistics, correlations, histograms, sparklines, animated charts, dashboards, trendlines, and more than 100 other charts and graphs. The book includes the following: ● Try and practice new Excel 2022 Charts and Reports in your Excel 2019, Excel 2021 and Office 365 editions. ● Learn with easy-to-read, step-by-step instructions and screenshots. ● Learn to illustrate your data in a way that is readily digestible at a glance. ● Figure out how t
Kenmerken
| Artikelnummer | 9300000129163421 |
|---|---|
| EAN | 9789355512536 |
| Categorie | Digital Reading |
| Productgroep | Boeken |
| Segment | Textual/Printed/Reference Materials |
| Prijs Nederland | € 10,49 |
| Prijs België | € 10,49 |
| Verzendkosten NL | Gratis |
| Verzendkosten BE | Gratis |
| Levertijd Nederland | Morgen in huis |
| Levertijd België | Morgen in huis |
| Verkoper | Partner |
Excel 2022 Pro 100 + PivotTables, Charts & Reports: Explore Excel 2022 with Graphs, Animations, Sparklines, Goal Seek, Histograms, Correlations, Dashboards (English Edition) bestellen bij snelkeus
Koop Excel 2022 Pro 100 + PivotTables, Charts & Reports: Explore Excel 2022 with Graphs, Animations, Sparklines, Goal Seek, Histograms, Correlations, Dashboards (English Edition) van Onbekend online in de categorie Digital Reading. Prijs € 10,49, levering in Nederland · Morgen in huis.